Thursday, 20 September 2018

Quick Primer on Interpreting the Support Resistance ideas and taking trades off it.

We post Banknifty trade ideas for short term and swing traders very often in our twitter feed.   So here is quick guide on how to trade the bank nifty ideas, interpret the information and derive meaningful short term, swing or options trade off it.
First of all, a support / resistance is not merely a line but rather treated as a band or a zone, reason being most intuitional activity doesn’t happen off one point. They have enough volumes to trade off one point really.
Will cover it in two quick parts- one how to interpret the levels and two how to trade off the zones.
Interpretation:
Most of the interpretation is simple color code base

  • A red zone- is supposed to act as a resistance zone and prices are expected to respect it
  • A green zone- is supposed to act as a support zone and prices are expected to hold that level.
  • A white line- these are potential target points for trades initiated off the red or green zones.
  • A Blue zone- is sort of a trend decider, trading above that have a bullish bias and trading below that have a bearish bias.


How to Trade the zones:
  • .    Primary hypothesis – is to look for pullbacks from the zones, so look for a downside move from a red zone and look for upside from a green zone. Trading isn’t simply about resistance and support at a time frame so use that with the larger context and the commentary provided for the day.

So this can be traded two ways, aggressive traders can have resting orders at the zone and defensive traders can look for a price confirmation before initiating the trade. My own approach is a hybrid approach if the volatility is low I have a resting order else go for real time markets orders to get a fill and a move. The zones give excellent RR based entry exit points.
  •     Secondary Hypothesis-  is to treat the zone the other way round once breached.so a resistance will act as a support and expect prices to bounce off it to intiate a long trade once resistance is breached.
  •     Once a trade is initiated I’m looking for the white line marked areas as the target range.
  •     A swing trader can use a resistance or a support zone as a confirmation, once done can continue to hold on a trade for a larger move.

Monday, 30 July 2018

Banknifty Futures Trade setup and Plan -week 30 July


Review and Recap:

BNF: Last week scenario II was to trade breakout above 27150 zone to test 27500 range, it went there and higher than that as well, testing yearly highs and beyond it.

Observations:

Challenge is prices have moved far off the vwap levels, and whenever it does a rotation towards vwap or consolidation is a better risk reward scenario, I have marked two times when that has happened recently


Trade Plan:

I.Prices manage to respect 27570 zones and we continue to move higher to test 27900 levels- which is a retracement of last weeks range and then look to trade a pullback from there. 
II.A move below 27570 range to test the levels of 27450- if that holds and markets pullback we are in for some up move more.
III.In continuation of scenario II preferable scenario is a move into the shaded zone of 27330-27250 range and look to trade a pullback from there, and that is the favored scenario this week.
IV.A contrarian scenario is markets to completely retrace this move and go on to test 27150-100 range all over again. Scenario has to be anyway tested first before that.


Sunday, 8 July 2018

BANKNIFTY Futures trade set up and plan- coming sessions

Banknifty futures continue to trade within the range created on the 1st week of june, that’s five weeks in a row, so much so that now a weekly plan almost looks like a daily plan from the range point of view.
But as a trader these are the times you need to continue to stay foot and don’t get complacent about positions and keep the plan going .

Coming back to the charts, Banknifty continue to trade and create value within the 38.2% - 78.2% retracement of the range. So until we get a confirmed close outside the range its best to trade a pullback to the range zones. There are two zones within this range that has good volumes 26540 on the higher side and 26360 on the down side. So here are the few trading scenarios coming to this week.


Trade plan scenarios:
  1. Primary hypothesis remains to trade back within the range, despite gap up or gap downs. In case the chart set up support.  So on the upside until 26640 is breached look for a pullback to 26540, 26380 levels. And on the downside look for a pull back to 26360 levels  until 26150 hold
  2. Trade a break out of 26640 to test  26790 and higher levels.
  3. Trade a break down below 26160 to test 26980 , 26850 zones.


My own bias still remains on the short side , that essentially means I will be careful with positions size on the long side and be more aggressive with the position size on the down side if a short opportunity looks viable.

Sunday, 24 June 2018

BANKNIFTY Set up & Trade Plan for Week Starting 25jun

BNF: Last week ,  Played out all 3 scenarios that we laid out, a test near 26150, consolidation and 26300 levels and a upward test for 26800 levels.


BNF continues to trade within the trading range formed on the 1st week of June. Testing the 78.2 % retracement, from there an upward push up to 27000, 27350 zones is a possibility. On the downside 26480-580 will support immediate support and a move below will be a good zone to test for a downward push


Now we could play out the below  scenarios  for next week
I.Continue upwards to test 27000, 27350 zones or higher, but given OI accumulation at 27000 I will be cautious for this scenario.
II.Move below 26750 and test the zones of 26580-480.
III.A break below 26350 to try and test 26150 and lower levels. Again at this point a break of 26100 looks difficult this week based on month end OI

Saturday, 23 June 2018

Perspective on Support Resistances & Context of The trend.

Below is one of the trades that I recently posted and how it worked post the trade idea was created. The post is not to talk about the profit of the trade etc. but what are some learnings and observations from the trade set up and such patterns keep occurring and can be used for future trade set ups as well.

First the trade Summary:
Posted on 20JUN: #USOIL #CL_F consolidating in a range. likely to take off if 66 is taken out for a quick test of 68.5-69 range (Price then 65.47)
Result: Price on 23 Jun : 69 USD

So how was the trade idea generated in the first place: we had series of lows on lower volumes and any sustained follow ups, while a big resistance zone laid ahead at 66 levels where we had a series of tops. So what that meant was while the buyers were not active the sellers didn’t find any follow up trades. What could this mean be that there were no new sellers emerging at the lower levels. Hence a contrarian buy idea if the level was crossed as that would mean sellers would have to force close the trade and could lead to short covering.


USOIL time for take off by PowerTrades on TradingView.com


How did the trade span out?

  • .We did move to cross 66, failed to sustain and fell back to test the lows.
  • Trend lows again gets respected.  And here is the catch here, just a trade based on support and resistance could had meant a trader would have reversed the trade there, while what was at best needed is to close the trade and look for a follow up on either direction, this comes from the context of the trend and that markets have failed to fine new sellers at lower levels.
  • Keep looking for an active trade on test of 66 and above or an aggressive set up could mean even a quick reentry once low was respected.
  • 66 again gets tested and this time on June-22 the lows fail to get below 66. So what was a resistance previously has now become a support, that’s a key observation to take home. – This is another opportunity for an aggressive trader to potentially take a low risk add up positions. And once there is no push below 66. boom it takes off.
  • Where does it pause. exactly at a low volume node, which again coincides with previous swing highs. hence that level acts as a double confirmation.

So, many lessons and pointer in a single trade journey. As a trader this is the observation and process to take home irrespective of the time period we trade. . S/R alone can lead to lot of whipsaws on false highs or lows. Trading on the alone could have led to 2 false trades in the above trade journey.

Trying to understand the context of market can do, in conjunction with support resistances is a powerful tool

Sunday, 20 May 2018

BANKNIFTY Setup and Trade Plan Week Starting 21May

Banknifty bucked the trend for the past few weeks, indicating a potential near term top
formation in the charts. This weeks most traded volume at 26450 will mark a significant
resistance zone and should be the range for the intermediate top ; i.e. to mean if we hold
the theory that markets have marked a top here, this level got to be respected, else the
hypothesis falls flat.

The downside was arrested late hours on Friday , when markets took  support at an
intermediate levels, and until we break below 25650 zones we are likely to see some
consolidation and short term pullback possibly as well. This also coincides with NF, which
found a base near prev zone of 10560 levels.Now we could play out the below 3 scenarios
and plan my trade as per that-
I.pull back to test the 26050-26100 zones and keep within the range of 26150-26750 in coming sessions
II. pullback to the range of 26050-26150 and manage to breakthrough to test 26450 and higher again
III.Break through below 25750 and and test 25320 zones.

I would try and potentially trade a short term pullback as that offers a lower risk reward if we get a
favorable set up , or /and look for a pause and turn around from the 26050-26150 zones towards the
downside. Overall at higher levels keep a bias of short on rise to test the weekly lows and lower
levels of 26500-350 zones , this until 26450 is cleared.


Sunday, 15 April 2018

Banknifty Set up Profile and Trade Plan Week 16Apr -2018

Banknifty marked a major consolidation in terms of the smallest weekly range on the weekly charts.
A quick recap of the previous week shows that the low marked couldn’t even get into the previous week’s value area, indicating that buyers emerged aggressively in dips. This resulted in the value area shifting higher as well significantly.
This indicates that the coming week will continue to be a consolidation zone with an upward bias for the traders.  The Banknifty PCR remains at 1.45 and the max pain at 25100. Support is likely to emerge in any dips to 25000-24940 zones and should see buyers emerging until markets cracks below that levels or breaks 24850.

On the upside resistance will be seen @ 25540-25600 zones and should see pull backs from there. Until the marked range in green and red doesn’t break in the below volume profiles charts we should see markets consolidate and set up base for the next direction.


Sunday, 1 April 2018

BankNifty Near Term Scenarios and potential trade setups

Banknifty marked a good late pull back in the last week of the series to test the weekly vwap @ 24500 levels. And managed to close below it @ 24300 zones. From a monthly candle perspective, we still formed a negative candle, where monthly highs tested the Jan lows but failed to go past it.
Now here are the few trade scenarios from here:
  1. Markets manage to respect immediate 24250 zones and pull back to cross 24500, it can test 24800 levels where a lot of selling pressure may emerge. Above 24800 markets can go on to test 25200 and 25500 levels.
  2. On the downside if markets break below 24100 it can test upto 23800 zones. Real selling pressure may only emerge on the break of that.


What could be interesting is that markets manage to test 24100 or lower and manage to pull back to do a test of 24800 in the coming sessions. Then we can see a direction emerging.


Sunday, 18 March 2018

BANKNIFTY FUTURES WEEKLY RECAP- 16 MAR & PLAN AHEAR

Banknifty had a very interesting last week, it started with the buyers pulling it back and ended up towards friday with sellers exerting a downward thrust.
at the end we closed with in a fairly balanced situation from the week perspective. Now until the lows near 24100 are broken we are still with an open chance to extend a pullback on the upside before the downard shift begins.


There are 3 possibilities that emerge for the current week 1. we continue to trade between 25000 and 24300 zones and consolidate further 2. we see a downward shift and 
break below 24100 and 3. we manage to respect the lows and consider it as an intermediate bottom to break on the upside past 25150 to test 25500 levels.

Sunday, 11 March 2018

BankNifty Multi Time frame Perspectives. Trading Ideas to plan your setups.

Hell it’s been ages since I posted here, although Have been regular on twitter and facebook, but it’s worth an idea to put down some perspectives on multi timeframes to help plan the trade over the next week and the next month or so.
Lets drill it down from a top down approach and try and establish how the levels converge. We will typically use price action charts, retracements and some levels.
On the long term charts the monthly charts here Banknifty (BNF ) Has formed a clear top with a tweezer top formation that clearly establishes a bearish reversal pattern and is usually followed by 2-3 months of intense selling and pullbacks marked at the lower end of the top. We had a follow up selling month already. Based on this chart pattern until 26000 levels are crossed its going to be a sell on rise for larger time frame traders.  On the downside there is a definite possibility to test 22600 levels.

BankNifty Monthly Charts


 Coming to Daily charts, we seem to have formed a temporary base near 24100-150 levels and until that level holds, its likely for a short to midterm pull back on the charts, whether that can last a few days to a few weeks, it will unfold over the next week or so. On the upside we have 3 primary zones to watch out for 25000 being the first one, then 25450 levels and then above that a tight band of 25650-25850 zones. Which is unlikely to cross for the downside view to hold. How strong will the pullback will be determined by local and global cues. The above scenario becomes null if we break below 24100 zones. In that case its time to look from the longer term perspective.

Banknifty Futures Daily Charts


Coming to immediate short term charts, last week we almost closed at the highest traded zone of around 24300 zones. Long term players are likely to emerge if we manage to move above 22380 levels, below that expect market to remain non conclusive.  Moving above that we can hit the 24650 & 24850 range on the upside, where it would be prudent to book gains and look for a reversal opportunity for swing players. Again this hypothesis holds good if we manage to hold the 24100 zones. If that zone fails below that we should aim for 23600 and 23100 levels.

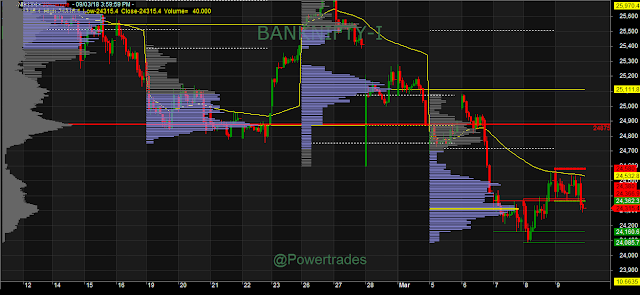
Banknifty Futures short Term Charts


Note: For more regular updates please follow our twitter(@powertrades) handle or facebook page.