Tuesday, 27 May 2014

MAY-2014 EXPIRY OPTIONS BUILD UP & EXPIRY TRADING IDEAS

May has been an extremely volatile and a big month for the markets and hence it will be keenly watched by option players to see where it tends to close from here. With two days to go for expiry we thought to bring up some interesting statics on the data for this month.

First a look at the options build up for May. As the graph suggests that the maximum buildup of options  is in the 7400 & 7500 range for CE. This indicates as serious resistance and more or less confirms that markets wont be pulling back above those levels in the next few days.


This is inline with our other analysis last week  where we had clearly marked that 7550 would be a big hurdle for the markets and in the last two sessions markets have exactly retraced from there.
On the downside option build up support emerges at much wider band of 7000-7200 levels and hence not much conclusion can be derived for a definitive levels.
Now also a look at the INDIAVIX Charts. INDIAVIX is currently in the consolidation band and faces serious hurdle at 25 levels and support at 13-15 zones. This would largely mean that volatility may further consolidate and hence markets may continue to remain in the wide band of 7200-7400 for a while.
So what would be the option trades for this expiry, we would say look for a pullback options opportunity from 7200 levels on the downside and 7400 on the upside.
We will also post an updated analysis on the morning of expiry day as well on the facebook page. Stay tuned
INDIAVIX combined with the option OI can potentially offer some great trade set ups in the markets. For both writers and option buyers.

NIFTY Options OI Data-27- May-2014


This is inline with our other analysis last week  where we had clearly marked that 7550 would be a big hurdle for the markets and in the last two sessions markets have exactly retraced from there.
On the downside option build up support emerges at much wider band of 7000-7200 levels and hence not much conclusion can be derived for a definitive levels.

Now also a look at the INDIAVIX Charts. INDIAVIX is currently in the consolidation band and faces serious hurdle at 25 levels and support at 13-15 zones. This would largely mean that volatility may further consolidate and hence markets may continue to remain in the wide band of 7200-7400 for a while.


So what would be the option trades for this expiry, we would say look for a pullback options opportunity from 7200 levels on the downside and 7400 on the upside.
We will also post an updated analysis on the morning of expiry day as well on the facebook page. Stay tuned
INDIAVIX combined with the option OI can potentially offer some great trade set ups in the markets. For both writers and option buyers. 


Thursday, 15 May 2014

THE BIG DAY: ELECTIONS RESULTS- Our Magic Options Strategy With Minimum Risk & Maximum Returns

16th of May is the D Day. The elections results for 2014 general elections are going to be out.   This will pave way of the next government.

The entire nation and specially the markets will keenly follow the election results. We all very well remember what the market reaction last time results were declared was.
Most exit polls have sung to the common tune of ab ki bar modi sarkar this time. The exit polls have signaled a positive outing for the NDA . The projections from channels vary from 250 odd to about 340. What is important to watch out is will NDA be able to achieve the magic figure of 272 or get to a close distance of it.  On the other hand we also know that exit polls can go way off the mark too ( last general elections exit polls most agencies got it way to wrong).
So expecting a volatile movement in the markets, we all know at least that the market may not stay at the same levels after elections. How to maximize the gains with a minimum calculated risk potential?

Apart from our advanced trading systems & advisory Powertrade have always endeavored to think out of the box an provide innovative investing & trading ideas (Our long time readers will recall our strategy of covered investing ,when we advised investors to go long in NIFTY ETF 6200 levels then http://powertrades.blogspot.in/2013/11/investment-or-trading-in-markets-at.html)
So lets have a plan to gain in the markets this elections.

Based on the exit polls we want to go Long in NIFTY, yet don’t want to loose if markets crack right?
First an analysis of NIFTY Levels

Nifty Has resistance at 7200 and a long term break out can be achieved above 7500 , where markets can even hit 7900-8000 zones in next sessions if that level is cleared
Similarly Nifty has critical support at 6900 levels and a any indication that NDA may fall short of the magic levels will mean a blood bath in the markets.
So here is our magic strategy to trade based on those two levels (7500 on upside & 6900 on downside)
Type
Strike
Quantity
NIFTY CE Long
7200 CE
100
NIFTY CE Short
6900 CE
50


Strategy Risk Reward:
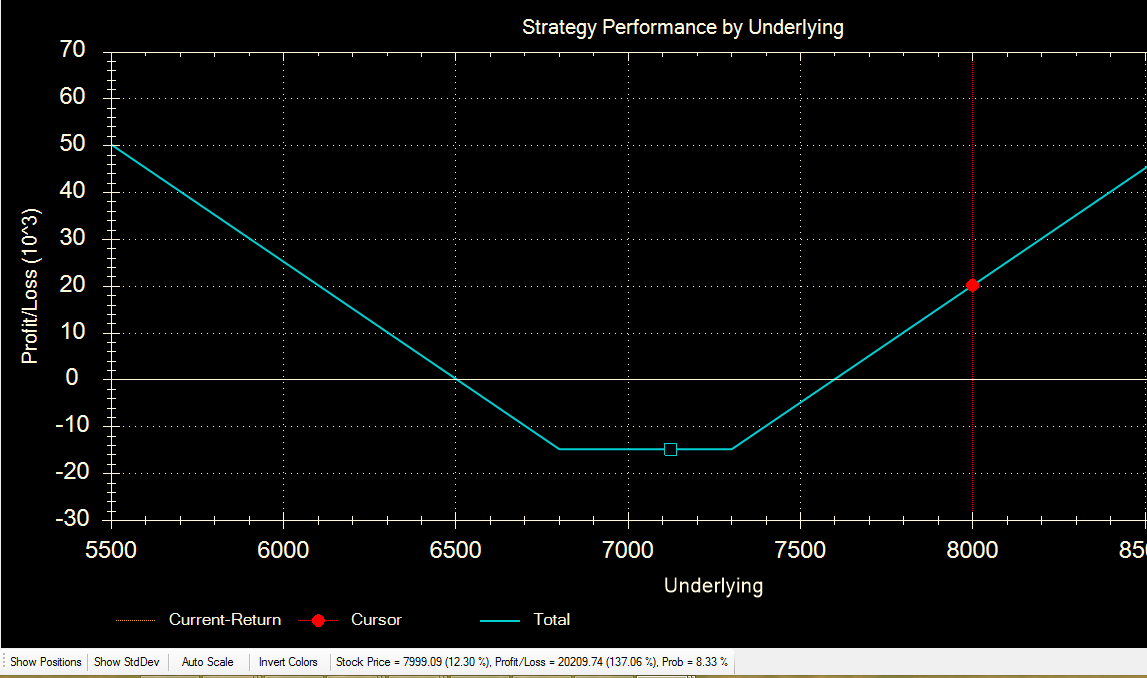
·         Gain if NIFTY reaches 8000: 23,566 INR Per Lot
·         Loss below 6900 (any level): -1640 INR Per Lot


This strategy is based on the premise that markets will react either way and will not stay at these levels and we want to be sure that we don’t lose if it falls

Alternate Long Only Strategy:
This is an alternate strategy for players who want to earn on either side by  and are expecting a big move in line with what happened after last elections. This strategy is also a long only strategy

Type
Strike
Quantity
NIFTY CE Long
7200 CE
50
NIFTY PE Long
6800 CE
50

Strategy Risk Reward:
·         Gain if NIFTY reaches 8000: 20,461 INR Per Lot
·         Gain if NIFTY Reaches 6300: 10,135  INR Per Lot


Monday, 17 March 2014

Elections 2014 & The Markets

India remains a favourite for #FIIs--------
Positive sentiment on expectations of a Modi-led NDA victory puts India ahead of other poll-bound emerging markets
Puneet Wadhwa | Mumbai March 11, 2014 Last Updated at 22:50 IST Business Standard 

===========================================
Despite the overall positive sentiment, analysts caution markets could correct in case the election outcome throws up a hung Parliament or a Third Front-led government. Even if the NDA is voted to power, the rally could take a breather, as investors wait and assess how the economic policies and reform measures in India take shape. “Only the equity market’s worst case scenario of a non-Congress, non-BJP ‘Third Front’ government can, we think, upset the Indian equities applecart,” says Manishi Raychaudhuri, managing director and Asia-Pacific strategist at BNP Paribas Securities.

Cheruvu of RBS says the chances of a Third Front government at the Centre are less than 10 per cent. If the Nifty rises to 6,700-6,800 in the pre-election rally, he expects it to correct to 6,200-6,300 in case of a negative outcome.


Dilip Bhat, joint managing director, Prabhudas Lilladher Group, says, “A decisive mandate might see the Nifty at 6,800-7,000, though it would be significantly ahead of the fundamentals. The question is can these heady levels be sustained? My sense is no. Markets will remain vulnerable to significant corrections from those levels. On the other hand, if a decisive mandate is missing, the Nifty could dip to 5,500-levels.”

Motilal Oswal, chairman and managing director, Motilal Oswal Financial Services, says: “The chances of a Third Front government are very low. However, in case such a government comes to power, we will see a 10 per cent correction in the markets from current levels and FIIs will press the sell button on India. On the other hand, even if Narendra Modi comes to power, incremental buying by FIIs will slow, as they will wait and watch how policy decisions shape up. So, either way, the markets will see some correction for some time after the elections.”

==========================================
Well #projections made public are always as confusing as they can be ....We @ Powertrade do not 

know what Markets can do...But unlike the Fundamental Legendary Experts of the Indian Markets we do not take #Trading as a Game of #Betting, instead our Smart Chartists believe TRADING IS A WAY OF LIFE. So Sincere #Chart #gazing and #Disciplined #Money #Management is our specialization to create #Real#Wealth....We Thrive on #volatile moves and TeamPowertrade Promises every member to identify the right moves at the right time...

Tuesday, 5 November 2013

Investment or Trading in the markets at High levels. Comparative Analysis & Low Risk ideas

In our last blog post we mentioned that Indian Indices are likely to relatively outperform the global indices and also shared some trading/ investing ideas to leverage this opportunity with lower risks
Here is a quick recap of the potential options to capture this opportunity  versus the global indices:

1.     Global futures specially Dow jones and FTSE are traded in NSE and can be used as a pair trading opportunity with our index( that is short in Dow Jones and Long in NIFTY)
2.     Similarly there are mutual funds which offer investing opportunities both in global markets and NIFTY ETF. If one is long on the former it may be a good time to switch into NIFTY ETF’s
3.     For those who want to stay to our markets, one can bet on relative upside and start picking stocks in a mixed manner. By mixed I mean pick up partly sectoral stocks that have outperformed since 2010 and pick up sectoral stocks that have performed mildly or underperformed since then


We received many feedback on this and expectedly lot of you want to try out option 3 ( that is keeping investment positions in the indian equity markets with a mix of opportunities
To take it from there we present here a comparative analysis of the various sectoral indices within Nifty.

NIFTY Sectoral Indices- Comparative Analysis


We have considered the following indices:
·         BANKNIFTY (NSE BANK)
·         CNXIT ( IT Stock indices)
·         CNX100 ( Top 100 CNX stocks)
·         MIDCAP Index (CRSMID)

The graph below presents how the indices have done against each other since the highs of 2010 was made.
It is clearly divided into three sections:

·         Outperformance: CNXIT
·         Flat performance: CNX100 & NIFTY
·         Underperformance: CNXMIDCAP & NSEBANK

Potential strategies in equity investments:

1.     Balanced Traders can Keep a mix of stocks especially from the top 2, that is CNXIT,CNX100 and NSEBANK. This way in case of a downward consolidation CNXIT stocks will ensure that the portfolio selection does better overall and in case of outperformance BANKING stocks may outperform the benchmark index
2.     Selective stock picking of not more than 10-20% from the mid cap sector. Look out for midcap banking stocks.

3.     Aggressive traders/investors can look at stock picking exclusively from NSEBANK & CNX100

Saturday, 2 November 2013

Markets near All Time Highs? Is it Time to Rejoice??? Or Time For Caution?


Sensex already made the headlines with marking all-time highs and NIFTY followed close with just a few points of the highs?

Few sessions back we wrote that we Indian Markets are likely to outperform the global indices and we are well on track for that.

But we also discussed one more thing, a good measure of calculating highs is to see the relative performance and relatively we are yet some way to go to call it a real high.

A large part of Nifty’s move has been contributed with the IT index while the other indices like BANKNIFTY and CNXMIDCAP are still quite off the high.
Also markets have been very volatile last few months giving tough time to intraday players. How does one trade the markets from these levels?

Discretionary calls? Trading Tips? Traditional Trading systems? Well None of them have worked so far… is’nt it?

Its time to take new guard, It is high time that you refined your trading approach and moved to something that offers stability and consistent growth. If you have not reviewed this Yet. It is time you do?

SmartSignals-Pro: Is an advanced algorithm based quant trading system that is going to change the way you have been trading, Be it and intraday trader or a swing trader. Simple follow the trading system and leave all the worries to the inbuilt smart algorithm which studies various patterns to automatically detect market moves.

Here is a snap of how in last few sessions the amazing system minted 17,000+ profit per lot.Beauty is it traded both short and long trades to capture that kind of profit.
Also see how the system did not take any trade during range bound periods.

BankNifty Futures- SmartSignals Pro
Want to Trade this system Live? Here are details below:


Advantages/Features of SmartSignals Pro:
  • Trading system for Both Nify & BankNifty Futures
  • No Setup Cost, Signals given Live over Yahoo Messenger
  • Automated Stoploss management, volatility adjustment
  • Advanced algorithm to detect range bound markets & avoid Trading
  • Intraday and swing mode both available

Now Trade With a Difference: No Tips, No Guess work, No Emotion--- Just Advanced Systematic Trading

Gear up to capture the next wave of market move with advanced Systems.

Smartsignals Pro
Launch Date:11th Nov 2013
Pre-Launch Booking Offer
6000 INR/Month
Monthly Charges
10,000 INR/Month

Wednesday, 23 October 2013

Comparative Analysis on Why Indian Market May Outperform Global Indices


A post after quite a time,
This time around we will discuss on how markets are poised to move from here and how we have done so far using a different parameter
While we wander around all time highs how are our markets shaping up to move from here? Performance is usually measured in  absolute terms. That typically means what is the absolute growth we have seen so far.
Which is a near 0% growth since the market tested the highs in 2010. Another refined way of measuring performance is on relative terms.
In relative terms it will be interesting to see how badly have we done against the developed economies? we have underperformed the developed markets ( for comparison we treat DJIA and S&P as reference indices)
Here is a chart to depict the magnitude of the underperformance. One chart as usual is worth many words.

NIFTY v/s DOWJONES RELATIVE ANALYSIS


While US markets have moved 40% since 2010 we have just reclaimed the top (0%).

Now since the degree of deviation is significant, this increases the chance that we will close this gap in the near future. This is a reason to believe that we may look to outperform the global markets in the near future?
This has also been confirmed with the short term move? Now have a quick look at the last two months data point.  Since the last two months we have moved 15% on the upside while Dow has moved about 4.5 %

NIFTY v/s DOWJONES v/s S&P: short term comparison


Note this just means we are likely to outperform. Which means that in case we  are likely to go up more than the global markets and when markets correct we are likely to go down less in percentage terms.
How to use this as an opportunity:
Yes the analysis is fine, but how do I capitalize on this.? Well there are a more than few ways to do so:
1.      Global futures specially Dow jones and FTSE are traded in NSE and can be used as a pair trading opportunity with our index( that is short in Dow Jones and Long in NIFTY)
2.      Similarly there are mutual funds which offer investing opportunities both in global markets and NIFTY ETF. If one is long on the former it may be a good time to switch into NIFTY ETF’s
3.      For those who want to stay to our markets, one can bet on relative upside and start picking stocks in a mixed manner. By mixed I mean pick up partly sectoral stocks that have outperformed since 2010 and pick up sectoral stocks that have performed mildly or underperformed since then

Wednesday, 25 September 2013

Nifty Review of the market movement. Analysis of Options data

Here is a quick update on what on the trading charts that we have discussed two days back. It was spot on swing trade with respect to that level. Let us discuss what is in store for the upcoming sessions.

The other day we posted that Nifty Future has resistance around 5960 levels. We mentioned that all pullbacks to that level will be shorted.  Nifty on 24th September made a high of 5962. We also mentioned that Downside target emerges at 5810-40 zones. Market today found support at 5820 and retraced back from there.

Our swing traders were short at the break of the 5960 levels and exited at 5840 just in line with the trading levels posted.

Immediate hurdle lies now at 5905 levels and trading above that markets will try to retrace back to the trading levels of 5960 on the upside. On the downside it will be better to try pull back trades on dips with stops at 5810 levels.

Fresh short trades will again be active in case Nifty future manages to close below 5800 trading levels.

Here is also an analysis and review of what the options data are suggesting since we are nearing expiry options accumulation along with price point analysis provide good levels for low risk pull back opportunity and some fantastic break out opportunities.
Here is a look at the options chart:

NIFTY OPTIONS ACCUMULATION- 25 SEP-2013


Nifty has terrific accumulation at 6000 zones.  This suggests that it is the toughest resistance zones. Hence swing traders can look to short on pull back to that trading levels. Similarly support lies at 5700 and 5800 trading levels and this will offer support zones to the market on the downside. A breach of 5800 can trigger a slide to test 5700 levels in a short time.