Showing posts with label NIFTY OPTION STRATEGY. Show all posts

Thursday, 15 May 2014

THE BIG DAY: ELECTIONS RESULTS- Our Magic Options Strategy With Minimum Risk & Maximum Returns

16th of May is the D Day. The elections results for 2014 general elections are going to be out.   This will pave way of the next government.

The entire nation and specially the markets will keenly follow the election results. We all very well remember what the market reaction last time results were declared was.
Most exit polls have sung to the common tune of ab ki bar modi sarkar this time. The exit polls have signaled a positive outing for the NDA . The projections from channels vary from 250 odd to about 340. What is important to watch out is will NDA be able to achieve the magic figure of 272 or get to a close distance of it.  On the other hand we also know that exit polls can go way off the mark too ( last general elections exit polls most agencies got it way to wrong).
So expecting a volatile movement in the markets, we all know at least that the market may not stay at the same levels after elections. How to maximize the gains with a minimum calculated risk potential?

Apart from our advanced trading systems & advisory Powertrade have always endeavored to think out of the box an provide innovative investing & trading ideas (Our long time readers will recall our strategy of covered investing ,when we advised investors to go long in NIFTY ETF 6200 levels then http://powertrades.blogspot.in/2013/11/investment-or-trading-in-markets-at.html)
So lets have a plan to gain in the markets this elections.

Based on the exit polls we want to go Long in NIFTY, yet don’t want to loose if markets crack right?
First an analysis of NIFTY Levels

Nifty Has resistance at 7200 and a long term break out can be achieved above 7500 , where markets can even hit 7900-8000 zones in next sessions if that level is cleared
Similarly Nifty has critical support at 6900 levels and a any indication that NDA may fall short of the magic levels will mean a blood bath in the markets.
So here is our magic strategy to trade based on those two levels (7500 on upside & 6900 on downside)
Type
Strike
Quantity
NIFTY CE Long
7200 CE
100
NIFTY CE Short
6900 CE
50


Strategy Risk Reward:
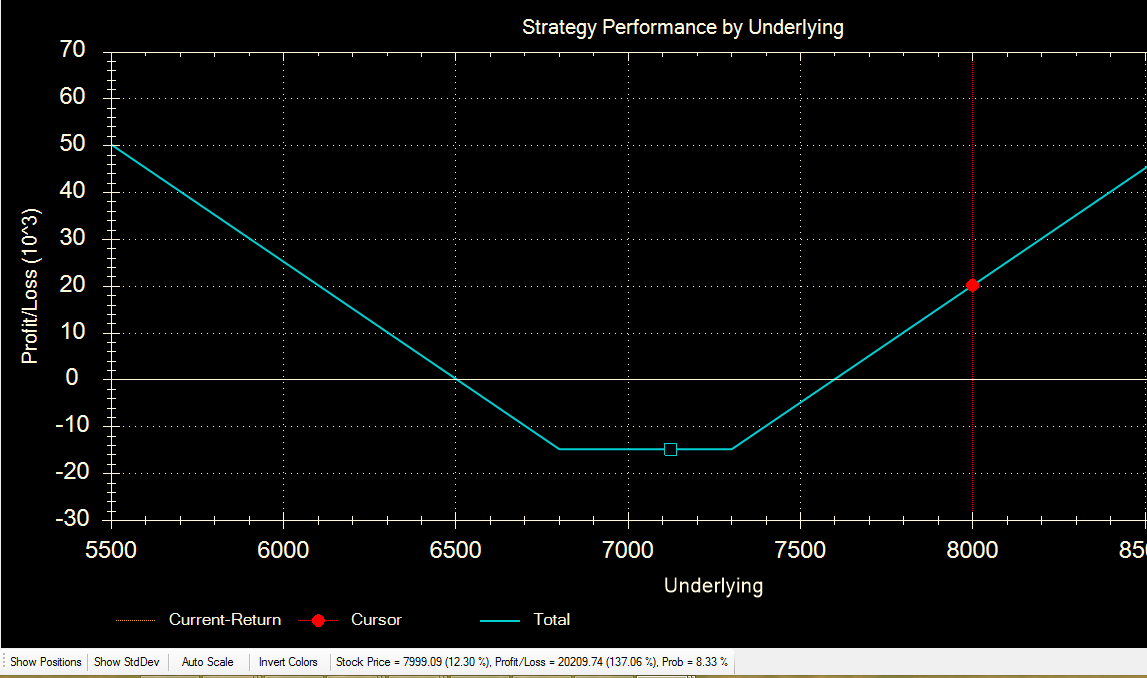
·         Gain if NIFTY reaches 8000: 23,566 INR Per Lot
·         Loss below 6900 (any level): -1640 INR Per Lot


This strategy is based on the premise that markets will react either way and will not stay at these levels and we want to be sure that we don’t lose if it falls

Alternate Long Only Strategy:
This is an alternate strategy for players who want to earn on either side by  and are expecting a big move in line with what happened after last elections. This strategy is also a long only strategy

Type
Strike
Quantity
NIFTY CE Long
7200 CE
50
NIFTY PE Long
6800 CE
50

Strategy Risk Reward:
·         Gain if NIFTY reaches 8000: 20,461 INR Per Lot
·         Gain if NIFTY Reaches 6300: 10,135  INR Per Lot


Wednesday, 25 September 2013

Nifty Review of the market movement. Analysis of Options data

Here is a quick update on what on the trading charts that we have discussed two days back. It was spot on swing trade with respect to that level. Let us discuss what is in store for the upcoming sessions.

The other day we posted that Nifty Future has resistance around 5960 levels. We mentioned that all pullbacks to that level will be shorted.  Nifty on 24th September made a high of 5962. We also mentioned that Downside target emerges at 5810-40 zones. Market today found support at 5820 and retraced back from there.

Our swing traders were short at the break of the 5960 levels and exited at 5840 just in line with the trading levels posted.

Immediate hurdle lies now at 5905 levels and trading above that markets will try to retrace back to the trading levels of 5960 on the upside. On the downside it will be better to try pull back trades on dips with stops at 5810 levels.

Fresh short trades will again be active in case Nifty future manages to close below 5800 trading levels.

Here is also an analysis and review of what the options data are suggesting since we are nearing expiry options accumulation along with price point analysis provide good levels for low risk pull back opportunity and some fantastic break out opportunities.
Here is a look at the options chart:

NIFTY OPTIONS ACCUMULATION- 25 SEP-2013


Nifty has terrific accumulation at 6000 zones.  This suggests that it is the toughest resistance zones. Hence swing traders can look to short on pull back to that trading levels. Similarly support lies at 5700 and 5800 trading levels and this will offer support zones to the market on the downside. A breach of 5800 can trigger a slide to test 5700 levels in a short time.

Wednesday, 26 June 2013

How to trade the Expiry Day. Low risk trading ideas for Expiry day

NIFTY FUTURE- Review and Trading Analysis-27th June

NIFTY FUT –   Firstly well isn’t market following a pattern pretty much in line with what we discussed. Refer to our blog charts previously posted. We had marked that the downside targets are near 5580 zones. NIFTY swing wise just marked that low for two consecutive sessions but yet managed to hold onto it on a closing basis. It will be critical to watch out how markets trade around that level and it can provide a very low risk trade opportunity on either side for swing traders. But advise would be to watch out for the expiry to pass by until we see a convincing move.
Since we are looking at expiry the volatility provides some fun trading ideas specially keeping options positions in mind. So let us review what are the option as of today.
The best way to analyze option data is just to have a look at the option accumulation chart. One picture gives in multiple data points in a single view.
June 2013 series-Option OI Data-26th June

<charts attached at www.powertrades.blogspot.com>

So the most evident thing with this chart is the huge CE accumulation at 5700 zones . Also we see significant and distributed PE accumulation at 5500 and 5600 levels. Now our expiry strategy needs to be treat this accumulation has to hold for tomorrow and use price point analysis to find out potential trading zones
Based on this our boundary points more or less are 5570-80 zones on the downside and 5700 on the upside. So to take a low risk entry one should look at sharp pull back trades in rise with stops above 5700 levels and also pull back on upside to trade for a close above 5600 levels. Probably with 5550 as stops. This trade can be taken in sharp dips.
Dear remember expiry day is risky hence risk lower than your usual quantity. Even if you don’t get favorable levels its perfectly fine to stay out and watch. Trade safe


Trading levels for the day:

POWERTRADE BEARS LAST STAND POINT OF THE DAY ----- 5620-25  sustaining above which it will target 5655,5675
POWERTRADE TREND DECIDER OF THE DAY ------- 5575-80
POWERTRADE BULLS LAST STAND POINT OF THE DAY------- 5550-55
Breakdown and sustaining below POWERTRADE BULLS LAST STAND POINT OF THE DAY will open target for support of ---- 5530,5505

Wednesday, 13 March 2013

NIFTY broke through the 5900 levels? Where are markets headed. Take a detailed look at NIFTY levels


NIFTY broke through the 5900 levels? Where are markets headed. Take a detailed look at NIFTY levels

NIFTY FUTURE- Review of 13th Mar
NIFTY FUT –  broke through the 5890 support levels and closed on the lower side of the day near 5860 odd levels.
The first sign of that weakness was confirmed in the morning session when NIFTY FUT traded below our  BULLS LAST STAND point of the day at 5915 levels. Again the importance of those levels are firmly emphasized on an intra day. Once markets failed to clear that level trading weak was imminent.
Then we hit the swing support zones of 5890 levels which got sustained for a while and was eventually broken we did try that pull back trades at 5905 levels with stops and reversal below  5888 , which got stopped out eventually when that level broke.
On the downside we marked the targets of 5890 and 5860 after the break of our BULLS LAST STAND point at 5910.
Check the charts for the market low made – low made at 5858 bang on at our pre market levels
Hope traders were able to stick to the levels and enjoyed  a decent trade.
While we had marked that 5860 and 5830 are strong swing support zones but the pace of the fall now calls it to be  tested.
Is this the right time to take a contrarian pull back opportunity or we take a break down short? Read the strategy at our next post.


NIFTY FUTURE – 14th  Mar  Trading Guide
NIFTY FUT closed at a crucial juncture of 5860 odd levels. This is a pivotal juncture for the markets and around 30 points here and there the market momentum and direction will be tested on a mid term basis.
It will be a good time to also see have a quick glance of how the options data is shaping up at these levels.
The options data suggest there is a significant build up of puts at 5700 and 5800 levels and at the same time the CE build up is more around                 5900 and 6000 levels
Based on that data 5900 may form as an immediate hurdle in recent times. At the same time we may see a support zones around 5830 based on price point analysis and 5800 based on option data points.

So for swing trade wise this zone of 5830-5900 for this series may prove to be the range bound zone and will be better off to try for pull back trades within this zone.

On at intraday basis 5860 will form as the immediate trend decider and trading above or below it will decide the next course of action for the day. On the upside if NIFTY FUT manages to hold above 5860 may show a pull back to 5890 zones.
On the downside a break of 5860 can lead to a test of levels of 5845-5830 zones and lower levels upto 5800 .

Swing indicator wise the short term momentum indicator are negative now and will hold so until NIFTY FUT trades below 5900.. The mid term momentum indicators are  will swing to negative below 5860 and positive above 5925 levels..

Trading levels for the day:

POWERTRADE BEARS LAST STAND POINT OF THE DAY ----- 5990-95 sustaining above which it will target 5990,6025,6040
POWERTRADE TREND DECIDER OF THE DAY ------- 5855-60
POWERTRADE BULLS LAST STAND POINT OF THE DAY------- 5825-30
Breakdown and sustaining below POWERTRADE BULLS LAST STAND POINT OF THE DAY will open target for support of ---- 5800, 5765

Thursday, 7 March 2013

Markets back at 5900, Where is it headed Next? Read the Detailed analysis


NIFTY FUTURE – Review of 7th Mar
NIFTY FUT –   Another fantastic day in a row , in a rare occasion we have see the markets giving such strong moves in a such a short span and that’s pretty welcome amongst the swing trading and intraday trading community.
Yesterday we mentioned that NIFTY FUT has key levels at 5825 and trading above that can hit the swing levels of 5860 levels.
Look at how the markets spanned out once NIFTY FUT managed to sustain above that level( Also our TREND DECIDER of the day) it managed to challenge our BEARS LAST STAND point at 5860 levels. This also was our swing hurdle as well. To quote exactly what we wrote “At the same time on the upside if now NIFTY FUT manages to break above the 5860 levels that will be deemed as a strong reversal sign for the market.”

Look at the strong movement witnessed once that level was cleared , NIFTY FUT blasted to hit the next trading levels of 5900 in no time at all.
We has also mentioned that there is a congestion zone at 5910 levels this is exactly where the rally paused. Hope traders took the trading opportunity to book in massive gains. We had a solid run with our smartsignals too, as that is designed to catch volatility and strong trends. Clocking in more than 800 points in total in last few trades.
But that’s  not what the beauty is, the satisfaction more comes from the fact that we, our readers and traders  stuck to our convictions on both occasions when common sentiment challenged our belief and we collectively reaped in good gains.
During Budget day common sentiment called for a rally but we went short just as per our trading levels. And Recent up move in last few days when common sentiments said markets are in a bearish phase we stuck to basic technical analysis and levels and again came out winners. It’s a pat in the back for all of us.

NIFTY FUT closed at a very crucial  level of 5900 levels. Its time now to sit back and  introspect a longer time analysis again and take an informed decision for the next course of the market. Read our detailed analysis for tomorrow.


NIFTY FUTURE – 8th  Mar  Trading Guide

Before we start out I  just want to again drill this thing again within our traders that when we talk about technical analysis there is no place for emotions. Its an informed decision based on probabilities, patterns and risk reward ratios. We don’t have to go to common sentiments to find an opinion.
Sample this, When markets were making highs in Jan 2013, did any analyst come out and project that 6120 is a hurdle? We wrote about that level long before it tested , check our blog posts.
When we saw the budget day crash and a few days before it too. We kept on writing that 5630 zones are strong swing support and they did deserve low risk contrarian entries. Did any analyst ask to do that after the budget? We stuck our neck out and did that.
And again the point is not that we are correct all the time, but an informed pattern based decision was taken rather than following common emotions. Secondly the conviction to trade the plan was equally important.

Coming back to NIFTY let us quickly review how the options data have changed over the week. Here is a snapshot of options data early this week  and the snapshot of options data today for comparison


NIFTY OPTIONS SNAPSHOT-5TH MARCH


NIFTY OPTIONS SNAPSHOT-7TH MARCH


If we review the two options charts now there are three evident take away: The 5700 and 5800 PE accumulation have increased significantly justifying the fact that they are emerging as support zones from a series perspective and thirdly the 6000 CE accumulation has decreased too, meaning that the hurdle in that space may be decreasing but still there in  a significant manner. So does 6000 also mean anything else?

Let us go back and see the weekly charts one more time, we reviewed the charts some time early this week.


NIFTY FUT WEEKLY CHARTS-7TH MAR


Swing indicator wise the short term momentum indicator remains positive above 5860 levels. . The mid term momentum indicators are now positive as well and will continue to hold so until NIFTY FUT trades above 5790 zones.


As we see from the weekly charts, this week charts by taking out the 5860 levels have completely engulfed the previous week, Although the volumes are still lower on the pull back candle by a significant margin.

Second cause of concern is that if we review the long term trend line that we see which was breached  4 weeks back. The trend line resistance now also stands at 6000 levels.   Combing these few observations 6000 emerges as a strong swing hurdle now and we need to watch out for that in the coming sessions in a swing basis on the upside.


On an intraday basis now, NIFTY FUT faces immediate  resistance at 5915 levels and clearing that wil go on to target 5940 levels. In case NIFTY FUT manages to trade above 5940 as well we can see a test of the swing resistance zones of 5975-6000 levels. Which will be a definite hurdle to be watched out for. In case we manage to hit that level, it will be advised to lock in gains and wait for the next leg of market directions.

On the downside NIFTY FUT will face good immediate support at 5855-60 levels and until it trades above that level all intra day corrections will be bought into. In case that level is breached NIFTY FUT will slide down quickly to test the 5830 odd zones.

Swing indicator wise the short term momentum indicator remains positive above 5860 levels. . The mid term momentum indicators are now positive as well and will continue to hold so until NIFTY FUT trades above 5790 zones.

Trading levels for the day:

POWERTRADE BEARS LAST STAND POINT OF THE DAY ----- 5910-15 sustaining above which it will target 5940,5975
POWERTRADE TREND DECIDER OF THE DAY ------- 5860-65
POWERTRADE BULLS LAST STAND POINT OF THE DAY------- 5825-30
Breakdown and sustaining below POWERTRADE BULLS LAST STAND POINT OF THE DAY will open target for support of ---- 5800, 5760


Saturday, 2 March 2013

Trading Review of 1st March and Market Analysis for 4th March


NIFTY FUTURE – Review of 1st Mar
NIFTY FUT –  Despite the volatility  we got it spot on for Friday. Its always difficult trying to analyze a potential move after a big day like Thursday.  Specially for intraday traders to trade after a big day comes with higher risks of volatility as the range of trade has expanded.
For Friday we warned traders to be careful while taking shorts and only look for it on pull backs. These are the cases when the trading levels again come handy.
We wrote that the TREND DECIDER is near 5695 levels and in the morning session once the markets managed to hold above the TREND DECIDER our immediate action was to either wait to look for it to break or a potential short on rise if at all.
NIFTY FUT then went on to hit our BEARS LAST STAND point and also go above that level as well to make a top just below our swing resistance levels of 5760.
Let us review what we wrote about the crucial 5760 levels --- “NIFTY FUT faces immediate hurdle at 5730 levels and trading above that can again move up to test the 5760 odd levels. This will form as the immediate swing trade decider and only a move above that can ensure a mid term pull back Till that range is cleared all pull backs may be shorted”

This same trade was followed to perfection where NIFTY FUT made a top just below it and managed to close within the trading range. Hope traders capitalized on this and managed a decent trade.

Also an interesting thing to note is NIFTY FUT just closed at the BEARS LAST Stand point. This becomes important as 5730 was also the swing support zones we discussed before the break down eventually happened. Let us review going forward how to trade the markets in the coming sessions.

                                                                                                                     
Folks who love systematic trading can follow our Automated Stock Calls posted live at our Facebook page : www.facebook.com/powertrade.trading


NIFTY FUTURE – 4th  Mar  Trading Guide
NIFTY FUT –   closed near the crucial swing levels of 5730. This was the previous break down levels that we were watching out for. At the same time if we go and analyze the daily candles formed, the Daily candle formed today was an inside candle  and was well within the trading range of the previous session.

The fact that the high made was also within 5760, makes that as the clear next trading range to watch out for, in case 5760 is cleared on a sustained basis we may see a good strong move to test the 5900 zones all over again.
From an immediate day trading perspective it is imperative to watch out for 5730 as the trend decider and if NIFTY FUT manages to trade below it the bias will be negative.
On the downside a break of 5690-5700 will ensure the that down move continues and NIFTY FUT goes on to test the lower levels created on 28th Feb  that is near 5760, and below it to test the swing support levels of 5630 odd zones.
So in summary safe traders or short term swing traders may look to take a trade of break of either side of the range created on Friday that is long above 5760 zones and short below 5690 zones.
Risky traders or scalpers can created positions on either side of 5730 or  try pull back trades with 5690 stops  and reversal below or 5760 stops and reversals above.

Since it is the start of the series and also one of our friends suggested to have  a look at the options data here we present to you an options charts data of the current series, this one single snapshot tells us where the options accumulations are.

NIFTY OPTIONS VIEW- MARCH SERIES- WEEK1


As we see with the chart where the Put value are plotted in green and the Call values are plotted in Red. Since accumulation mostly happens on written options it is the puts which will tend to form as support and calls that will tend to form as resistances and hence the color coding.
With this we see that the maximum Put accumulation is at 5700 strike price, this additionally implies that the 1. A clear of 5760 can see a strong move above and  2. That a break of 5700 will be resisted and once broken we can see a strong downside surge again.

We also see a call highest call accumulation is at 6100 levels and a that will form as the swing resistance for this series , which is also in a way obvious as the swing top was made at 6120


Trading levels for the day:

POWERTRADE BEARS LAST STAND POINT OF THE DAY ----- 5760-65  sustaining above which it will target 5790, 5820
POWERTRADE TREND DECIDER OF THE DAY ------- 5730-35
POWERTRADE BULLS LAST STAND POINT OF THE DAY------- 5695-5700
Breakdown and sustaining below POWERTRADE BULLS LAST STAND POINT OF THE DAY will open target for support of ---- 5665,5635

Friday, 1 March 2013

How to make massive gains in event based movements without a risk


Budget day movement came a surprise to many and for our traders that was a massive gainer. We got few questions on how to trade event based news with minimum risk and yet be able to gain good gains out of them.
First we have to have two hypothesis  to trade events- 1  Is that the outcome of an event can be any, or in case of something like budget the interpretation of the even by the market can be either positive or negative. 2- Based on the outcome we will see a massive change coupled with increased volatility in a short time.
So how to trade based on these two hypotheses. Normally we don’t recommend buying options at all but these are the best situations that an option trade can be taken in  a hedged manner.  Why hedged? Because as per hypotheses 2  as a trader I don’t know what is the outcome of the event. So I will take a hedged trade ensuring that either way the movement is I gain out of it? Yes that’s the beauty of trading a hedged option long, you will make profits on movement of either way.
Let us review the trade we took,  when NIFTY FUT was hovering around  5800 we asked our traders to buy equal quantity 5800 CE and 5800 PE. Both were trading at around 22 rs per lot. So total payout is 44 INR per pair of option.
Since we don’t know the outcome but as per our hypotheses we know a strong movement can happen either way. But now at that stage we were in complete peace as our trade would had been profitable where ever the market moves.
When markets fell and NIFTY FUT closed near 5700 our 5800 PE closed at 110 levels and 5800 CE was just 2 INR. Net gain per pair was 112 INR.giving our traders a gain of a whooping 155% profit per pair without  any risk at all.
Lets say the markets would had moved in the positive direction and closed at 5900 levels. In that case the 5800 CE would had been around 110 and the 5800 PE near 2 INR still giving us the same gains of 155% irrespective of the outcome.
See the graph at for a better illustration of the movement and outcome.

option pair trading for News event- Risk free outcomes