Hell it’s been ages since I posted here, although Have been
regular on twitter and facebook, but it’s worth an idea to put down some
perspectives on multi timeframes to help plan the trade over the next week and
the next month or so.
Lets drill it down from a top down approach and try and
establish how the levels converge. We will typically use price action charts,
retracements and some levels.
On the long term charts the monthly charts here Banknifty
(BNF ) Has formed a clear top with a tweezer top formation that clearly
establishes a bearish reversal pattern and is usually followed by 2-3 months of
intense selling and pullbacks marked at the lower end of the top. We had a
follow up selling month already. Based on this chart pattern until 26000 levels
are crossed its going to be a sell on rise for larger time frame traders. On the downside there is a definite
possibility to test 22600 levels.
 |
| BankNifty Monthly Charts |
Coming to Daily
charts, we seem to have formed a temporary base near 24100-150 levels and until
that level holds, its likely for a short to midterm pull back on the charts,
whether that can last a few days to a few weeks, it will unfold over the next
week or so. On the upside we have 3 primary zones to watch out for 25000 being
the first one, then 25450 levels and then above that a tight band of 25650-25850
zones. Which is unlikely to cross for the downside view to hold. How strong
will the pullback will be determined by local and global cues. The above
scenario becomes null if we break below 24100 zones. In that case its time to
look from the longer term perspective.
 |
| Banknifty Futures Daily Charts |
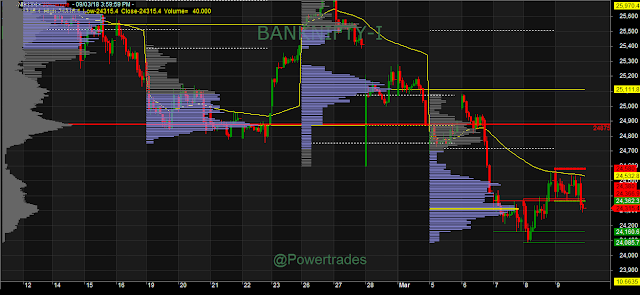
Coming to immediate short term charts, last week we almost
closed at the highest traded zone of around 24300 zones. Long term players are
likely to emerge if we manage to move above 22380 levels, below that expect
market to remain non conclusive. Moving above
that we can hit the 24650 & 24850 range on the upside, where it would be
prudent to book gains and look for a reversal opportunity for swing players.
Again this hypothesis holds good if we manage to hold the 24100 zones. If that
zone fails below that we should aim for 23600 and 23100 levels.
 |
| Banknifty Futures short Term Charts |
Note: For more regular updates please follow our twitter(@powertrades) handle or facebook page.
