Sunday, 18 March 2018

BANKNIFTY FUTURES WEEKLY RECAP- 16 MAR & PLAN AHEAR

Banknifty had a very interesting last week, it started with the buyers pulling it back and ended up towards friday with sellers exerting a downward thrust.
at the end we closed with in a fairly balanced situation from the week perspective. Now until the lows near 24100 are broken we are still with an open chance to extend a pullback on the upside before the downard shift begins.


There are 3 possibilities that emerge for the current week 1. we continue to trade between 25000 and 24300 zones and consolidate further 2. we see a downward shift and 
break below 24100 and 3. we manage to respect the lows and consider it as an intermediate bottom to break on the upside past 25150 to test 25500 levels.

Sunday, 11 March 2018

BankNifty Multi Time frame Perspectives. Trading Ideas to plan your setups.

Hell it’s been ages since I posted here, although Have been regular on twitter and facebook, but it’s worth an idea to put down some perspectives on multi timeframes to help plan the trade over the next week and the next month or so.
Lets drill it down from a top down approach and try and establish how the levels converge. We will typically use price action charts, retracements and some levels.
On the long term charts the monthly charts here Banknifty (BNF ) Has formed a clear top with a tweezer top formation that clearly establishes a bearish reversal pattern and is usually followed by 2-3 months of intense selling and pullbacks marked at the lower end of the top. We had a follow up selling month already. Based on this chart pattern until 26000 levels are crossed its going to be a sell on rise for larger time frame traders.  On the downside there is a definite possibility to test 22600 levels.

BankNifty Monthly Charts


 Coming to Daily charts, we seem to have formed a temporary base near 24100-150 levels and until that level holds, its likely for a short to midterm pull back on the charts, whether that can last a few days to a few weeks, it will unfold over the next week or so. On the upside we have 3 primary zones to watch out for 25000 being the first one, then 25450 levels and then above that a tight band of 25650-25850 zones. Which is unlikely to cross for the downside view to hold. How strong will the pullback will be determined by local and global cues. The above scenario becomes null if we break below 24100 zones. In that case its time to look from the longer term perspective.

Banknifty Futures Daily Charts


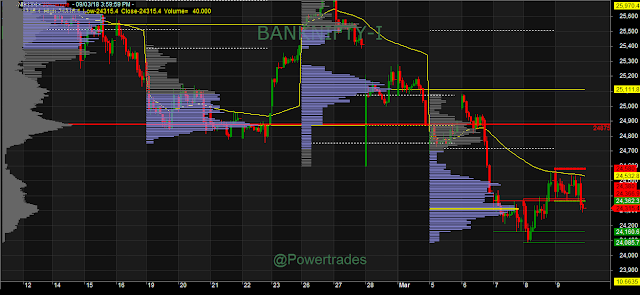
Coming to immediate short term charts, last week we almost closed at the highest traded zone of around 24300 zones. Long term players are likely to emerge if we manage to move above 22380 levels, below that expect market to remain non conclusive.  Moving above that we can hit the 24650 & 24850 range on the upside, where it would be prudent to book gains and look for a reversal opportunity for swing players. Again this hypothesis holds good if we manage to hold the 24100 zones. If that zone fails below that we should aim for 23600 and 23100 levels.

Banknifty Futures short Term Charts


Note: For more regular updates please follow our twitter(@powertrades) handle or facebook page.

Monday, 7 November 2016

US Elections Dates And Trading Plan for Next Few Sessions

US polls Starts on November 08 and results are expected to come out by November 9th in the next 24 hours.
The race for the 45th president of United States has picked up some pace and has become much closer than that anticipated.
The race is between Hillary Clinton (Democrat) and Donald Trump (Republican). US elections are a two party system.  The markets in large favors the Democrat, partly for two reasons. 1. It kind of maintains a status quo with respect to policies of the democrat already pursued by Obama and 2. Mainly because Trump’s views are perceived as nationalist right wing and hence he favors trade and employment protection, which markets and businesses hate in general.
This is an event which is neither in our control or hands to predict or make work, however one might say. The thing is that there are only two possibilities so by random behavior 50% of predictions will be correct.
Lot of traders fail in the business of trading is because they perceive to believe that markets will work their way, while it is way beyond their control. Do we know the outcome- No, Can we trade the Outcome- Probably Yes. But the smart bet will be to trade it with a plan where the risk is capped, or the potential to earn on a move on either side. 
Knowing to manage your risks and protect your capital is more than half the job done.
This is where systematic trading / mechanical trading gives in the discipline to follow a strategy over and over again rather than being speculative.
The race recently picked up some steam because of possibilities of black votes swinging in favor of republicans and the alleged accusations into the email controversy. At the time of writing this, FBI has given Clinton a clean chit.
The Results will mostly by out by November 9th, 2016 9:30 AM IST
.How are markets expected to react?
Expect a volatile November series for the rest of the month, hence there can be possibilities of short bursts of directional trades. Advice would be to trade a time frame lower in this case to lock in gains. Especially until volatility subsides. This means if you normally trade daily charts, adjust and trade hourly charts.
My own hunch is that that even after that till the Christmas breaks market will remain a volatile traders market.
From a technical point of view until the base of 8450-8500 holds we will expect an upside. In case Clinton wins, which is a still better probability we can see a bit of euphoria for some time
To trade the markets, I advise that traders use our ProQuants Hedged strategies and manage the risks while ensuring good returns too.


Tuesday, 20 September 2016

The Big Question- Where is NIFTY headed


NIFTY has been subject to a lot of speculation over the last couple of weeks owing to recent volatility and another test to take out the top. NIFTY marked a psychological high just below the famed 9k mark.
Then we have had a decent sharp correction testing the recent uptrend. There are multiple macro factors in play in upcoming time which will also shape up how markets are behaving.

One of the big factors that has gone unnoticed is that the corporate loan market in India is not really picking up and most corporate are on a bond buying spree. What this means is that corporate are not really looking at business expansion and are playing safe (i.e. they see no demand).


                                       Syndicated Loan Data (Source:Bloomberg)

This doesn’t auger well if we are looking for markets making new highs or if we expect India to be growing at over 7% GDP as earnings will soon fall behind. ( The data suggests that from a loan point of view we are at the lows of 2008)
This will of course mean further pressure on the central bank for rate cuts and that can pump up the markets.
Let’s now look at this from a technical perspective. NIFTY futures have been largely trading within this channel since Feb this year. A breakout or a breakdown outside this channel will lead the next round of market moves.


                                                    NIFTY Futures Daily Chart

Now, why did we choose to write this now? Well here is another interesting analysis. We have done a quick analysis where NIFTY futures formed an Inside candle two days in a row (What this means is that the subsequent two days candles are within the range of the first day). The white dots represent the occurrences.  We had 5 such instances in the last 1 year and 2 of them being in September along. Most of this has always been preceded by a big price move. So brace up for that and this can be a good trading opportunity keeping the channels in view.
There are two seemingly important impact events over this week (FED and BOJ ) this can be a catalyst but eventually markets take their own course once the dust settles and many times most of these are factored in barring surprises as well.

Wednesday, 27 July 2016

BankNifty near term trade analysis


 BankNifty in range of 18900 to 19070. Breakout of this range will move to 19180 and above it 19360, on downside it can slide to 18580 below 18900 which will make Nifty fall below level of 8500.

Friday, 29 January 2016

Automated Investing & Trading with Mechanical & Systematic Trading systems

Automated Investing and Trading has been a revolution of sorts in the Investing world. PowerTrades automated systems gives you the power to generate profits for you while you are away, working sleeping or travelling.
Many investors have already tried some systems in the markets, which are not tested for different scenarios and end up failing in one situation or the other. Powertrades has designed and handpicked professional trading systems that have serious return potential and can provide an emotion free stress free alternate source of revenue for investors. Our systems have been tested over 20K data points for consistency.

Change the Way you Invest and trade for ever:
Profit in bear markets
Beat the markets in the Bull Markets
Fully Automated Risk management in Trades
100 % emotion Free Investing
No Monitoring or softwares  required
System is active even when you are away
Diverse portfolio and Increased Income

Investing and Trading typically becomes risky or a loss making venture when we dont use a proper method for entry and exit with defined money management or when investors become emotional about positions and losses.
Our systems have been thoroughly tested for consistent returns over different market conditions. This factors in even overnight volatility and movements. We use a special blend of handpicked systems that combine various conditions to take an entry and exit decisions. The money management is automatically updated by the system and varies based on different market conditions and volatility.

Over 2015 our Algo system has generated the following return:


www.Powertrade.co.in  has introduced a new feature where you can trade with our mechanical System through our algorithmic infrastructure. The infrastructure is hosted in our servers so it doesn’t require you to be manually present or active all the time. You still get summarized view every day and have access to your account all the time.

Trading Strategy Cost: 15,000 INR/ Annum
Monthly Server cost: 500 INR/Lot
Trading Underlying options: NIFTY Futures / BankNifty Futures/Crude Oil Futures


Get Started in 3 Simple Steps:
1. Register with Powertrade. To know more call +91-9038216000
2. Open a Trading Account & select the Underlying you want to Trade
3. Account is mapped to our systems and Your Live.


To know more reach out to us at +91-9038216000 or Email us at support@powertrade.co.in

Know more about our Trading Solutions & Systems, Visit www.powertrade.co.in or connect with us at twitter @powertrades &
 Facebook: www.facebook.com/powertrade.trading


Wednesday, 18 November 2015

Where are the Markets Headed Next? How to handle the Volatility

BankNifty Futures: 18th was a copybook trading day and fortunately we were on the right side of the trade as well. check our pre trade analysis at (https://www.facebook.com/powertrade.trading/)

This can be primarily be attributed to conviction in the plan as much as right analysis for the plan. Why did we mention that 17140 is a key zone?( we know the market reaction once that was breached)

If you check the hourly candles there were multiple instances when that was respected and it was building up supply there. beyond that we saw a straight dash to 16900, to be honest the ease with each was broken was surprising.
BankNifty Futures Price Chart Analysis


Now whats next?  The new Trend decider now is 16940-50 levels if you observe the charts.  until we manage to hold or trade below it pull backs on intraday basis can be shorted.  Downside targets can be near 16650 or lower. It will be key to observe whether the breach today was an aberation or a build up of new trend. Hence prudent would be to see how that level is treated. If markets moves and holds above it can give a good pull back trading opportunity to the contrarian players. 

NIFTY Futures: Just yesterday we discussed that 7850 continues be the achillies for NIFTY and until convincingly taken out we are not going to see aconclusive breakout. On the downside we discussed a break of 7820 can provide a low risk trade and what a trade it was , a trade which yielded nearly 80-100 points with a 30-40 points risk.  now that NIFTY has breached 7800, 7780-7800  range will be the trend decider. If markets sustain above it expect a reversal in trends.Below it markets will continue to trade in the direction that has emerged today. 7850 will be a tough swing hurdle going forward. A break above it will only signal a resumption for the bulls